
Key findings
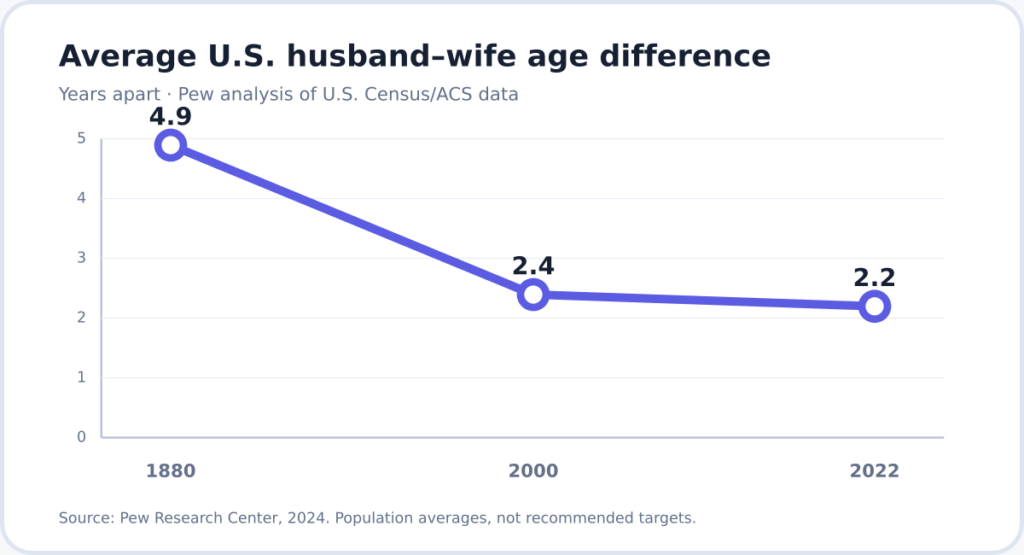
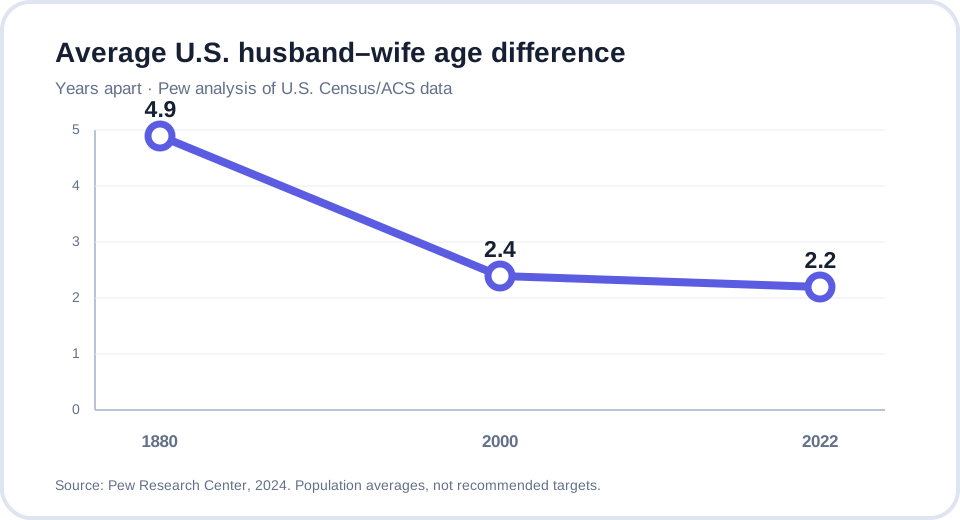
Pew Research Center reported that U.S. husbands and wives were an average of 2.2 years apart in 2022, down from 2.4 years in 2000 and 4.9 years in 1880. The article defines “same age” as within two years for parts of its analysis.
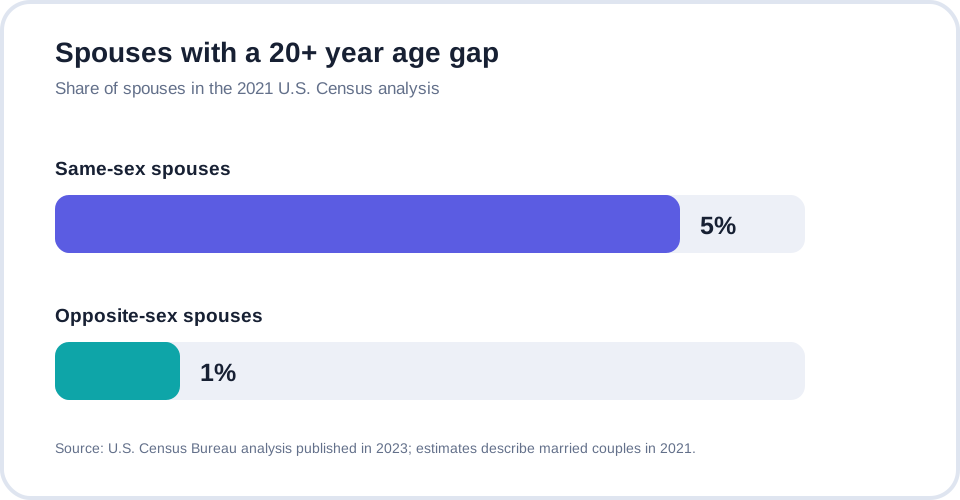
U.S. Census Bureau reporting also shows meaningful variation by couple type. A 2023 Census story reported that same-sex spouses were more likely to have larger age differences; 5% had gaps of 20 years or more, compared with 1% of opposite-sex spouses.
Newer 2025 opposite-sex couple context
A U.S. Census Bureau article published in April 2026 reported that more than one-third of opposite-sex couples living together in 2025 were within one year of the same age. It also reported about 5.1 million couples in which the male partner was at least ten years older, compared with about 1.3 million in which the female partner was at least ten years older. These figures use a different dataset and population scope, so they are presented separately rather than merged into the historical average series.
How to interpret the numbers
An average is not a recommended target. It summarizes a population. Age-gap distributions also change by age at marriage, remarriage, culture, geography and how researchers define a couple.
Limitations
- These figures are primarily U.S.-focused.
- Different studies use different datasets and definitions.
- Household data cannot measure private relationship quality.
- Sex, gender and couple categories may be defined differently across surveys.
Primary sources
Editorial note
We link directly to primary government data or the organization that conducted the analysis. Future updates should record the dataset year separately from the publication year.
FAQ
What is the average spousal age gap in the U.S.?
A Pew Research Center analysis reported an average difference of 2.2 years among husbands and wives in 2022.
Are most spouses close in age?
U.S. Census research indicates many spouses are within a few years of each other, though patterns differ by couple type.
Do statistics predict a specific relationship?
No. Population statistics do not determine the health or future of an individual relationship.
How to read age-gap statistics responsibly
An average compresses thousands of relationships into one number. It does not show the full distribution, explain why couples formed or predict an individual outcome. Median values, percentages and ranges may tell a different story from the mean.
Definitions can change the result
Some datasets examine married different-sex couples; others include cohabiting or same-sex couples. A study may measure the husband-minus-wife age difference, an absolute difference regardless of gender, or age at marriage rather than current age. Comparisons are only meaningful when definitions match.
Why country and year matter
Marriage timing, education, income, migration and cultural expectations vary across populations and over time. A statistic from one country should not be presented as a universal benchmark. Census-style administrative data can offer broad coverage, while surveys may contain richer context but smaller samples.
Statistics and relationship outcomes
When a study reports an association between age difference and satisfaction, stability or fertility, other variables may also be involved. Income, age at marriage, previous relationships and social support can overlap with the measured pattern. Association is not proof of cause.
Editorial standard for this page
Figures should be attached to a named source, geography, population and reference year. We prefer primary statistical agencies and clearly described research methods. When a source updates its data, the publication date and wording on this page should be reviewed rather than silently blending figures from different periods.
Frequently asked questions
What is the most common age gap?
The answer depends on the country, couple type and dataset. Many spouses are close in age, but the distribution includes both older-male and older-female pairings.
Can an average tell me whether my gap is large?
It can provide population context, not a personal verdict. Your exact ages and circumstances remain more relevant.
Why do different websites report different numbers?
They may use different years, countries, definitions or summary measures. Always inspect the original source and methodology.